Carbon dioxide and Sea surface
temperature.
Roy
Spencer plays with data in a failed attempt here. He attempts to explain that the rise in
atmospheric CO2 has mainly come from rising sea surface temperature, SST.
I only recently came across Spencer's blog though
it was written back in 2009 and thought it relevant to discuss this in light of
the present El Nino of 2015. The relevance is discussed here.
A coherent and consistent explanation is generally accepted for the rise of CO2 since the start of the industrial revolution. This explanation includes the causes for the trend in CO2 and different causes for the variations in CO2. There is little doubt that the trend is caused by human activity and in particular the burning of fossil fuels.
There is
continual movement back and forth between the atmosphere, biosphere and oceans;
however these are net fluxes that
are indicated.
In spite of
the oceans warming, the oceans are net absorbers because of the extra CO2
pressure from the atmosphere
Roy Spencer
challenges this and while not stating his conclusions explicitly he makes
strong implications:-
According to
Spencer something is causing SST to increase and this is most likely to be due
to changes in cloud cover for reasons unknown and the cloud cover conveniently
changes at a level too small to measure. Spencer suggests this change in SST is
the main cause of CO2 to rise in our atmosphere. To arrive at this viewpoint
Spencer uses a circular argument assuming it is true in the attempt to show it
is true. This logical fallacy on its own shows his argument to be false but
Spencer also requires mutually exclusive
arguments in an attempt to justify his arguments. Playing with data, Spencer
makes a “model”, (it is hoped he is not equating this to resemble anything like
a climate model) which is nothing more than an algebraic equation to which he
quickly finds a solution.
Confusing the
causes of trends with the causes in natural variation and confusing correlation
with cause, Spencer then makes a provocative claim that if scientists don’t
take this incredulous flawed argument seriously then they must be politically
motivated for doing so.
Perhaps
Spencer’s main flaw (although all the flaws are in fact fatal to a coherent
argument) is that any dubious conclusion he makes as to causes in natural
variations he assumes are applicable to the causes for the trends. While
attempting to consider some of the intricacies of natural variation he makes
simple fatal errors on explaining the simple basics. The complexities of the
variations are interesting and well worth investigating. (A repeat of the link
above is given here
which contrasts much with Spencer and explains the
significance of the lag that Spencer refers to). Rather than trying to clarify
these complexities Spencer uses them to obfuscate the simpler basics.
Spencer’s mutually exclusive
arguments.
Roy Spencer
disagrees with the diagram above. He doesn’t dispute the fact that the atmosphere
has been increasing in CO2 and presumably he doesn’t disagree that we have been
burning fossil fuels. So the top line in figure 1 is not disputed, give or take
a little uncertainty. What Spencer
disagrees with is the
net fluxes represented by arrows b and c into the biosphere and oceans and
furthermore he disagrees with their direction.
He cannot
make up his mind if arrow b or c should be reversed. For obvious reasons both
cant be reversed or the atmosphere would gain more than humans emitted.
He would like to argue the
“Coke-Fizz” effect ( arrow c reversed), the argument that warming oceans would
give up their CO2 due to them being warmer, but he knows this argument is
flawed so he jumps to the other argument that the biosphere could be net
sources of CO2 to the atmosphere but knowing this is also flawed he leaves it
vague which of these mutually exclusive arguments he proposes.
If the
oceans were net sources of CO2 (arrow c reversed) then we would require more
greening (arrow b to be most of the 10 Gt /year) and the oceans to be
increasing in pH (or becoming more alkaline, which is not observed)
The evidence of carbon 13 isotopes falling excludes
the possibility that the oceans are the sources of CO2 to the atmosphere.
Plants preferentially take up C12 and the oceans being the source would prevent
the C13/C12 ratio in the atmosphere falling to the extent for which there is observational
evidence. Aware of this Spencer “pre-empts” this argument by switching to the
biosphere as a net source. He states that “the C13 change is not a unique signature of fossil fuel source”. This is
true but is an example of a half truth. Spencer fails to acknowledge that the
reduction in C13/C12 ratio completely destroys his previous argument that the
oceans via the “Coke-Fizz effect“could be the source of the atmospheric CO2.
The
biosphere being a source for the CO2 could explain the C13/C12 ratio; however
he doesn’t dwell on this for long. This would mean the biosphere was ungreening ( he has argued on other posts that a benefit of burning fossil fuels is that it is causing greening of
the atmosphere) and the oceans would be gaining most of the 10Gt/year of CO2.
It would
appear that you are to momentarily believe that the oceans could be the source
for CO2 and if you find a flaw in that argument you can perhaps believe the
biosphere is the source. Not only are both these arguments flawed but they are
mutually exclusive unless you think that mass can somehow not be conserved.
Spencers
Circular arguments. Spencers Model.
Spencers “Model”
delta[CO2]/delta[t]
= a*SST + b*Anthro
This claims
that the CO2 gradient correlates linearly on a combination of SST anomalies and
an anthropogenic component.
Is Spencer
implying that his “model” based on a simple algebraic equation is supposed to
be a replacement for sophisticated climate models that use scientific laws and
data coded into computer language to obtain emergent weather patterns? One gets
the feeling he is hoping climate contrarians will infer this.
It is inconceivable that CO2
concentrations are proportional to an anomaly based on differences compared to a 1961 to 1990 average.
The value
for SST anomaly depends on what years we compare SST to. SST’s are compared to
the average of years 1960 to 1990. So the solutions for the co-ordinate values
that fit a narrowly defined period with a start and end date depend on this
choice. This means that Spencer decides how much is SST (which he calls
natural) and how much is anthropogenic based on this arbitrary choice.
If the
model is extended into the future, as long as CO2 emissions occur and
absolute values of SST increase, then
the gradient of CO2 concentrations will increase. This will mean an inevitable
exponential increase in CO2 concentrations that would indeed imply drastic
positive carbon feedbacks to carbon emissions. Any SST would mean that CO2
concentrations would rise without any emissions. Thankfully the model is
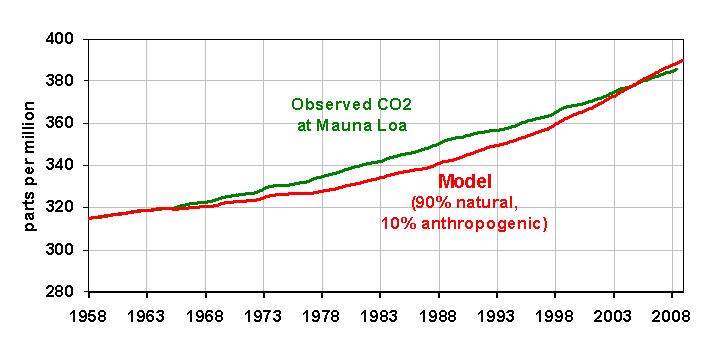
flawed; the exponential effect is seen in the graph above.
The observed
CO2 and the model are made to fit in year 1958 and then this formula is used to
calculate how the model changes over the time period. The coefficients a and b
are “solved” to give the best fit. The solution favoured by Spencer results in
the atmosphere at the present time gaining about 1Gt/year (10%) from
anthropogenic sources and hence 3.5GT from “natural sources” due to SST rise.
He doesn’t really explain where the other 9GT of human emissions goes.
In his
original graphs the anthropogenic component didn’t seem to fit well because he
decided to plot the rate of change of CO2 against time and depending on how
little the data is smoothed you can get wild fluctuations with this technique.
This is a common technique used by an obfuscator when they want to show
something that is well correlated not to be so. He didn’t use that technique when he wanted
his 90% “natural” plus 10% anthropogenic to fit well.
For an
explanation of the variations of CO2 associated with ENSO cycles along with
references see here.

